Resolution Tests
Canon Wide-Angle Zoom Comparison
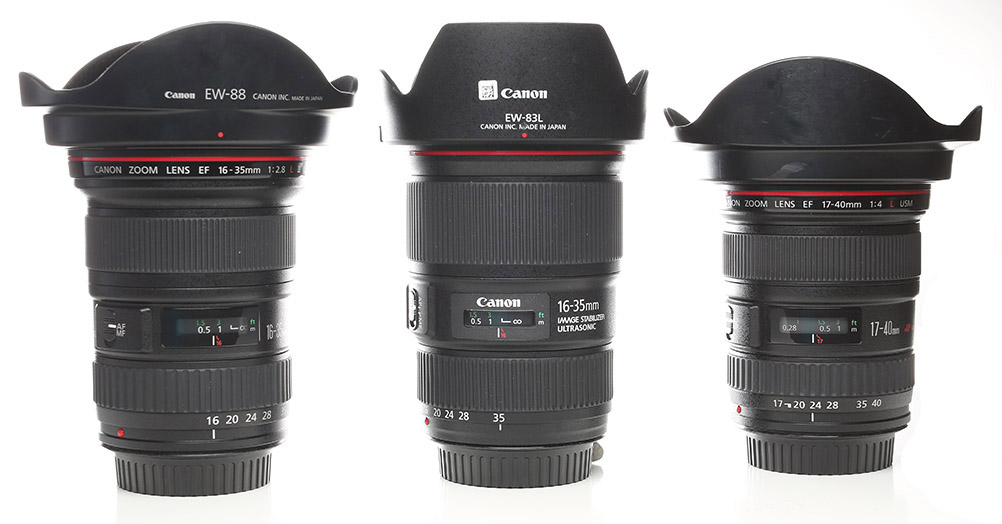
- Left to right: Canon 16-35 f/2.8 II, 16-35 f/4 IS, 17-40 f/4. Can you spot the one with the wrong hood? The intern obviously couldn’t.
As is so often the case, I bit off more than I wanted to chew when I came back from vacation. The Canon 16-35mm f/4 IS lens had just been released, a few copies were in stock, and I thought I’d do a nice quick test. But one of the reasons I’d wanted an optical bench was because I don’t trust Imatest results with wide-angle lenses. At 16mm, even with the very largest test charts, we’re testing at about 4 feet shooting distance.
So I after I did our standard Imatest on the 16-35 f/4 IS, I wanted to repeat the results on our optical bench. Of course, I don’t have a big database of optical bench results to compare against like I do with Imatest. So I had to do optical bench tests on some other wide zooms for comparison purposes. Then I had to do some more comparison with other lenses to see if the variations we were seeing on the optical bench were simply a new, higher resolution testing method, or if they were telling me something about variation with wide-angle zoom lenses. (Both things were true.) Anyway, the testing I thought would take a week has taken three.
I realize some of you just want to see the usual Imatest results on a group of these lenses since that’s what you’re used to seeing. Others are also interested in the optical bench results showing how the lenses resolve at infinity, rather than just close up. And of course there are a few of you who want all the gory details of Geekiness that the optical bench reveals. So I’ll try to present this in three parts: the Imatest results first, the optical bench optical test results second, and the geeky stuff third. It’s a buffet; just grab what appeals to you.
Imatest Results
We tested 10 copies each of the Canon 16-35 f/4 IS, 17-40 f/4, and 16-35 f/2.8 Mk II in our Imatest lab. The table below presents the average values of those copies. Center is the MTF50 at center of the lens. Average is the average MTF50 taken at 32 points across the surface of the lens. Corner average is the average of eight measurements, two (one vertical and one horizontal) in each corner.
Those of you who read a lot of our articles might notice the numbers given for the 17-40 f/4 L and 16-35 f/2.8 L lens are slightly higher than those we’ve presented in some older articles. This is because we now use larger, higher resolution test charts and different lighting. (And a good example of why comparing Imatest measurements between testers is an iffy thing to do.)
We tested the 16-35 f/2.8 Mk II at both f/2.8 and f/4 so it would have a level playing field. You can sort the table by clicking on the top row of whatever column you’re interested in.
Center Average Average Corner
17-40 f/4 L 17mm 1240 875 590
16-35 f/2.8 L 16mm at f/2.8 890 730 440
16-35 f/2.8 L 16mm at f/4 1360 970 615
16-35 f/4 IS L 16mm 1445 1185 795
17-40 f/4 L 40mm 1150 810 460
16-35 f/2.8 L 35mm at f/2.8 995 820 460
16-35 f/2.8 L 35mm at f/4 1315 1095 795
16-35 f/4 IS L 35mm 1360 1190 895
The conclusion is pretty simple: the new 16-35 f/4 IS has the best resolution. At 35mm, the 16-35 f/2.8 shot at f/4 is nearly as good, particularly in the center. The new f/4 IS is slightly better in the center, but it’s close enough that copy variation would have some overlap. The difference is a bit larger away from center. The 17-40, at the long end is clearly not quite up to the other two. (For completeness, the 17-40 f/4 is clearly better than the 16-35mm shot at f/2.8, but that’s a pretty unfair comparison.)
The difference is more pronounced at the wide end, where the 16-35 f/4 IS is clearly better than either of the other two lenses. As most of us are aware, the 17-40 does better at the wide end than the telephoto end, but it still can’t keep up with the 16-35 f/4 IS.
I know a lot of you want to see f/8 results, too, and we’ll try to do those in the near future, but for this test I decided I wanted more copies at each aperture rather than fewer copies at more apertures.
Semi-Conclusion
Obviously there’s a lot more to choosing a wide-angle lens than simply MTF50. Flare resistance is critical, off-axis aberrations are very important, etc. But from a purely resolution standpoint, the 16-35 f/4 IS is definitely better than either of the other two Canon wide-angle zooms.
There’s a value difference, too. The 17-40, at $839, is the least expensive of the bunch and is a pretty good lens. Personally, for $250 more, I find the 16-35 f/4 IS the better value both for its resolution and for the IS system, which I love on a wide lens. Many of you never use IS on a wide-angle zoom, though, so you may find the 17-40 a less expensive option. The 16-35 f/2.8 II lens has had a price drop to $1,560 with rebates. If you need f/2.8, you need f/2.8 and that’s your choice. You still benefit, though, because Canon dropped its price after releasing the f/4 IS lens.
I’ll add a bit of editorializing. I think Canon priced this new lens aggressively and I appreciate that. If it had come out at $1,500 it would still have sold. It’s that good.
This ends the quick summary portion of our program. If you just wanted to see the Imatest test results and get my opinion, you may go now. The rest of this post gets into the geeky MTF part of things. If you’re into that, I think you’ll enjoy it, and I’ve left you a couple of fun comparisons at the end. None of the information below is going to change the summary above, but it may add some interesting detail.
Those of you who are forging ahead, let me also warn you that the cool graphics we discussed in the graphics contest post aren’t quite ready yet. There’s way more work involved in that than I realized and it’s going to take some time to implement. So consider this MTF data presentation V1.1.
MTF Bench Results
Basic Methods
Imatest gives us MTF50 results, which are somewhat a reflection of how well the lens resolves. Imatest is also measured at fairly short focusing distances for a wide-angle zoom: a little over 4 feet for 16mm and just under 9 feet at 35mm using our largest charts. The optical bench tests at infinity focusing distance and gives us some additional information that isn’t easily available with Imatest.
One isn’t better than the other. They give complimentary data.
For bench testing we measured 9 copies of each lens. Each lens was tested 4 times, at 0, 45, 90, and 135 degrees of rotation. We use the distance scale mark on the lens as the reference for “0” degrees, so if you were facing the lens, the measurements would be made like the diagram below. If we were measuring on a camera, rather than the optical bench, that would give us top-to-bottom, side-to-side, and two roughly corner-to-corner measurements.
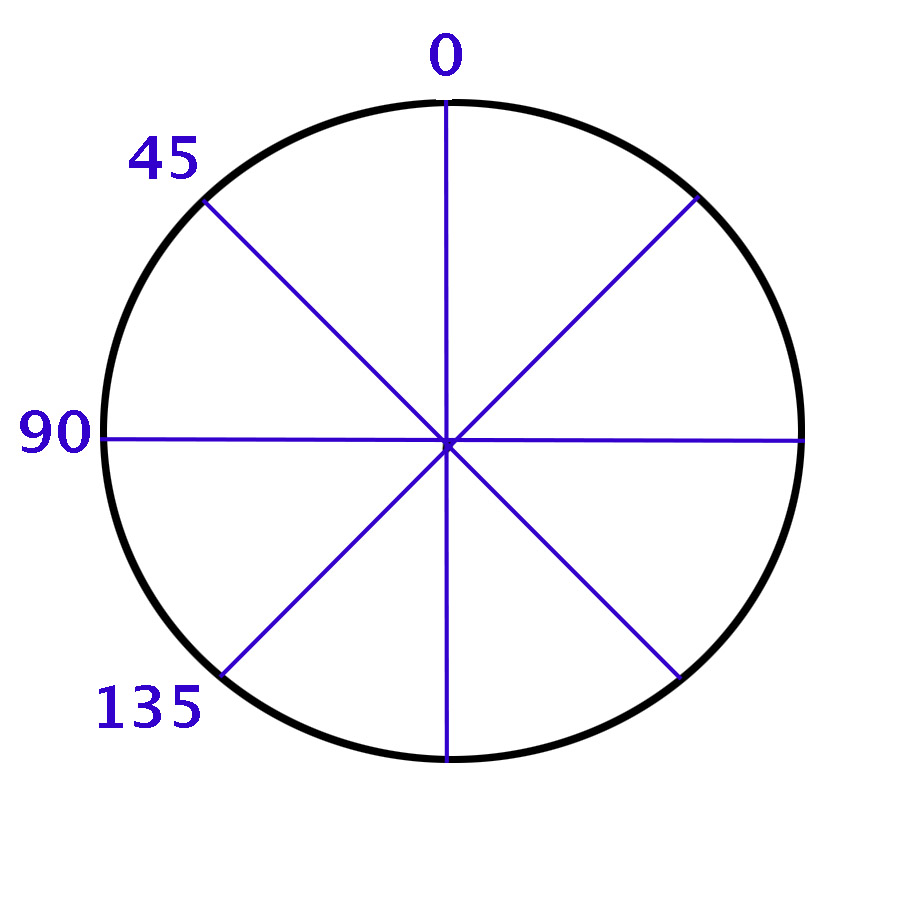 At each position we measure 20mm on either side of the center point (the absolute corner is about 21.5mm from the center, the horizontal sides are 18mm) in 2mm increments. I won’t bore all of you with how we handle the measurement data, but for both of those who want to know I’ve included it in an appendix.
MTF Charts
Just for whatever reasons, I should mention actual focal lengths. The 17-40mm measures 17.5mm to 39mm, while both the 16-35s measure 16.75 to 34mm, so there were no focal-length surprises with this group of lenses.
As was suggested after previous posts, we are going to show MTF readings up to 50 line pairs/mm. The graphs below are the average (mean) of all readings at each point.
You don’t need to be an MTF chart wizard to compare the results. Higher MTF is better. Dotted and solid lines of the same color close together is better than when they’re far apart. “0” is the center of the lens and 20mm is the far edge.
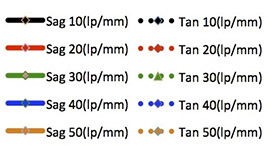
- Legend for MTF graphs
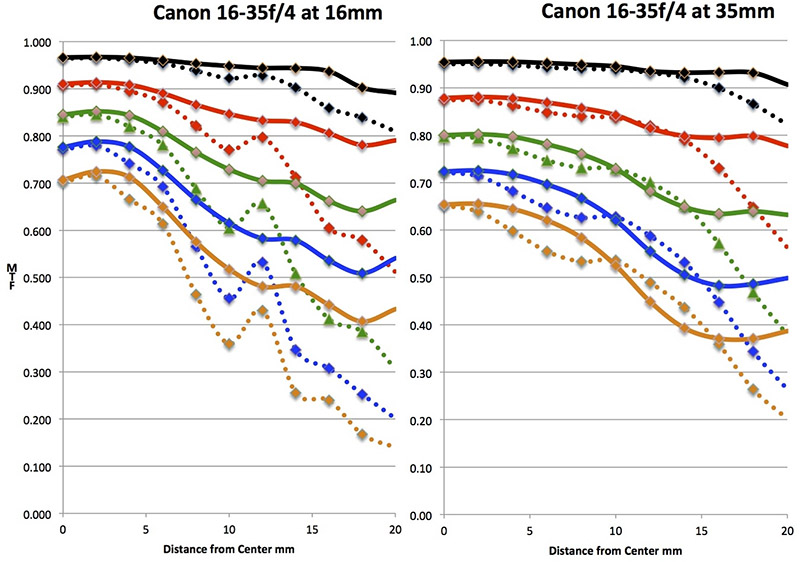
- MTF charts for the Canon 16-35 f/4 L IS at 16mm and 35mm
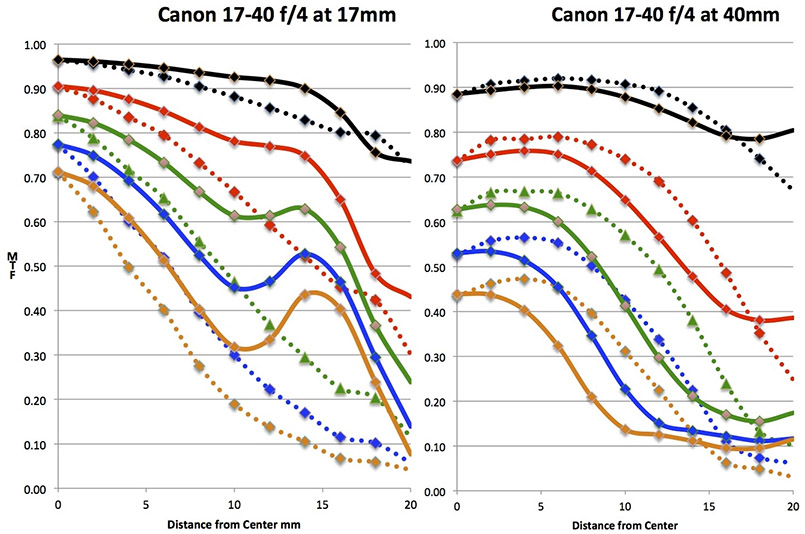
- MTF graphs for the Canon 17-40 at 17mm and 40mm
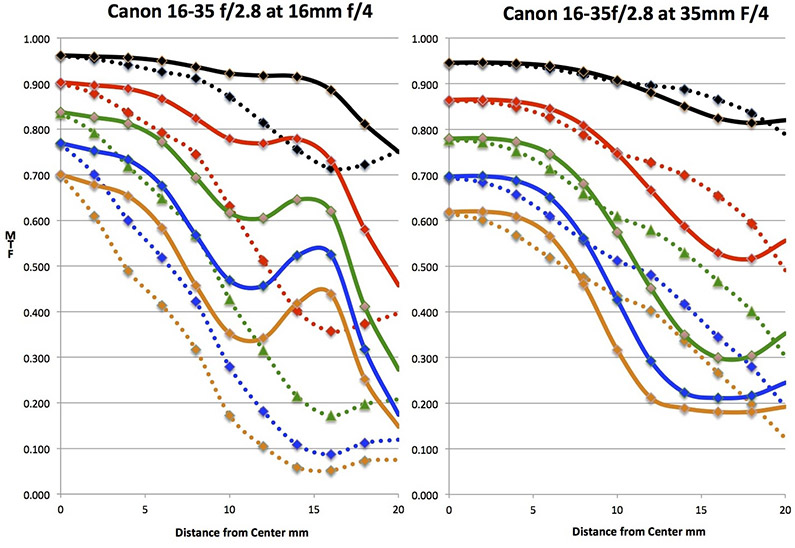
- MTF graphs for the Canon 16/35 f/2.8 test at f/4.
The MTF bench results are slightly different than Imatest, or perhaps just more complete. At the wide end, the three lenses are very similar right at the center, but once you move away from the center the 16-35 f/4 IS pulls away from the other two. In the outer 1/2 of the image (the 10-20mm distance from center) the 16-35 f/4 IS is clearly better and the further out you go the more difference there is. At the edges of the image (18-20mm) the difference is striking.
At the telephoto end of the zoom the 17-40 f/4 just isn’t as good as the other two lenses, even in the center. In the outer half of the image, the 16-35 f/4 IS is again clearly better than the others.
I’ll rearrange the wide-end graphs a bit to make the comparison easier, since most of us are interested in the wide end of wide-angle zooms.
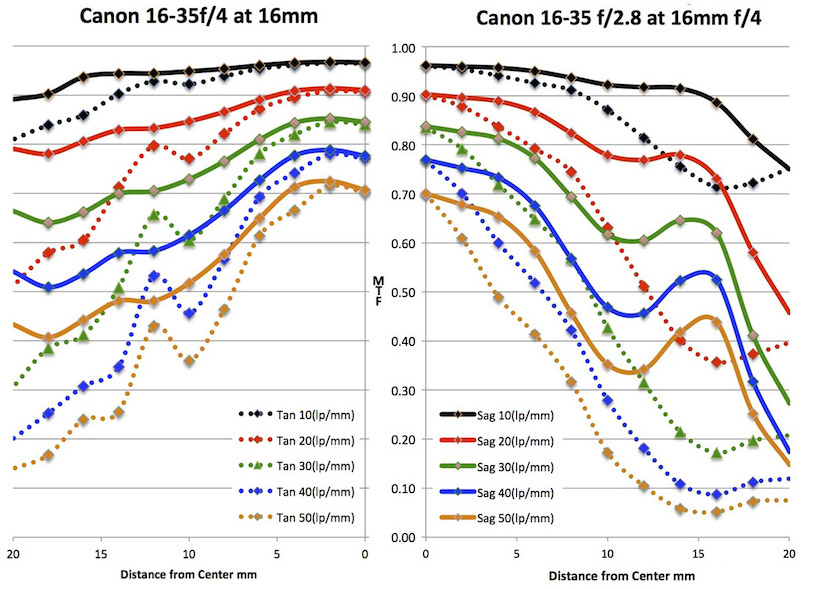
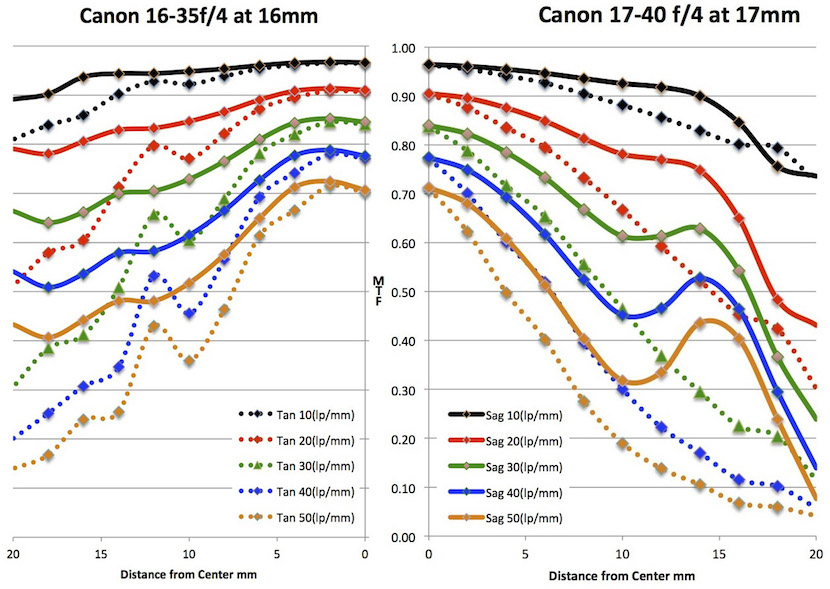
A couple of points are worth mentioning here. The first is that the 17-40 is better at the wide end than it is at 40mm, which most of us who shoot with it have always said. The other, which is also often mentioned, is that the 17-40 f/4 is better at the wide end than the 16-35 f/2.8. That is true if both are shot wide open, but if both are shot at f/4, as we did in this test, there’s not really a significant difference. On the other hand, if you’re going to shoot at f/4, no significant difference means the cheaper lens is a better value.
The second point is that the results are a little different when testing these three lenses with Imatest versus the optical bench. How much of that is testing distance (infinity for the bench, 4 to 9 feet for Imatest) and how much is different methods I can’t say — yet. That will have to wait a few weeks until the close focus adapter for our optical bench is available. For now, I just consider it two different ways to look at the same thing, and more data is always better.
Astigmatism
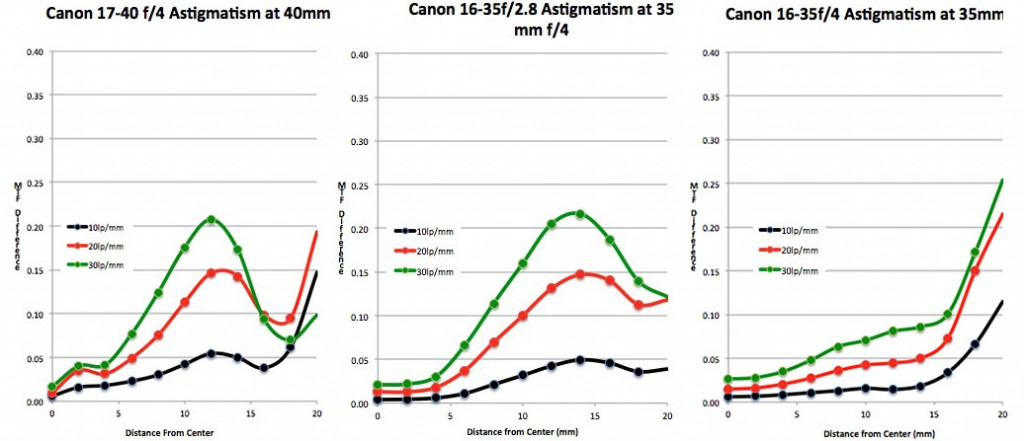
The MTF graphs above show the astigmatism, of course, but it’s sometimes helpful to look at the astigmatism separately. I’ll limit these graphs to 10, 20, and 30 line pairs/mm — the 40 and 50 line pair astigmatisms are very similar to the 30 line pairs/mm plot for all of these lenses. Again, these are multiple-copy averages. The astigmatism was very consistent between copies, though, with no outliers that were dramatically worse or better than other copies.
As you would expect, the astigmatism is more pronounced at the wide end and generally worsens the further you go from center. The 17-40 and 16-35 f/2.8 have less astigmatism further out, while the 16-35 f/4 IS seems to develop more astigmatism near the edges. But if you look back up at the MTF graphs above, you’ll see that what’s actually happening is that both the sagittal and tangential readings are dropping rapidly with the two older lenses, while with the new 16-35 the sagittal readings stay higher at the edge and only the tangential fall off. This increases the astigmatism number but gives better resolution.
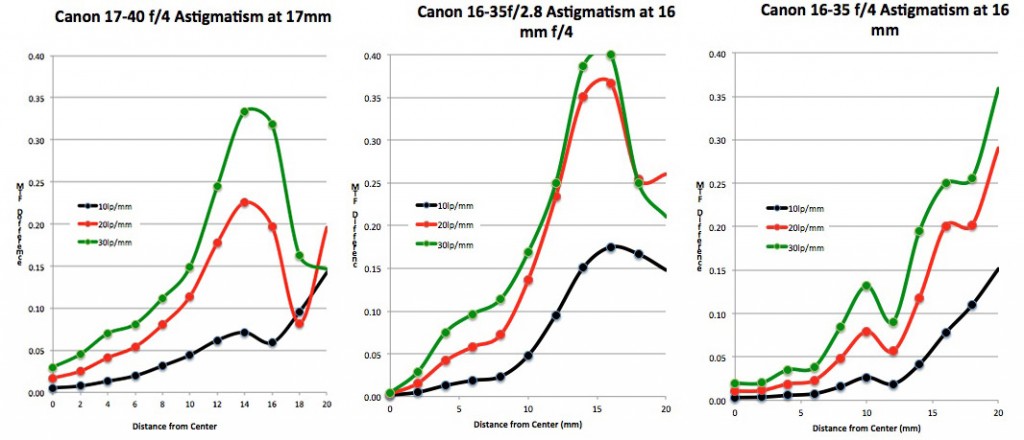
There’s far less astigmatism for all 3 lenses at the long end of the zoom range. I’d call the 17-40 and 16-35 f/2.8 (shot at f/4) very good performers, while the 16-35 f/4 IS is really amazing.
Field Curvature
The MTF bench gives us a nice printout of the shape of a lens’s field curvature, which is always of interest with a wide-angle lens. As you can see, the 16-35 f/4 IS and 17-40 f/4 have little field curvature at the wide end. At the telephoto end, the 17-40 f/4 has the most curvature and the 16-35 f/4 IS the least.
One thing to notice, though, is the lens designers really do know their stuff. If you look at even the most curved fields, you’ll see that the edges generally still fall in the sharpest area (lightest red color), although sometimes just barely in that range.
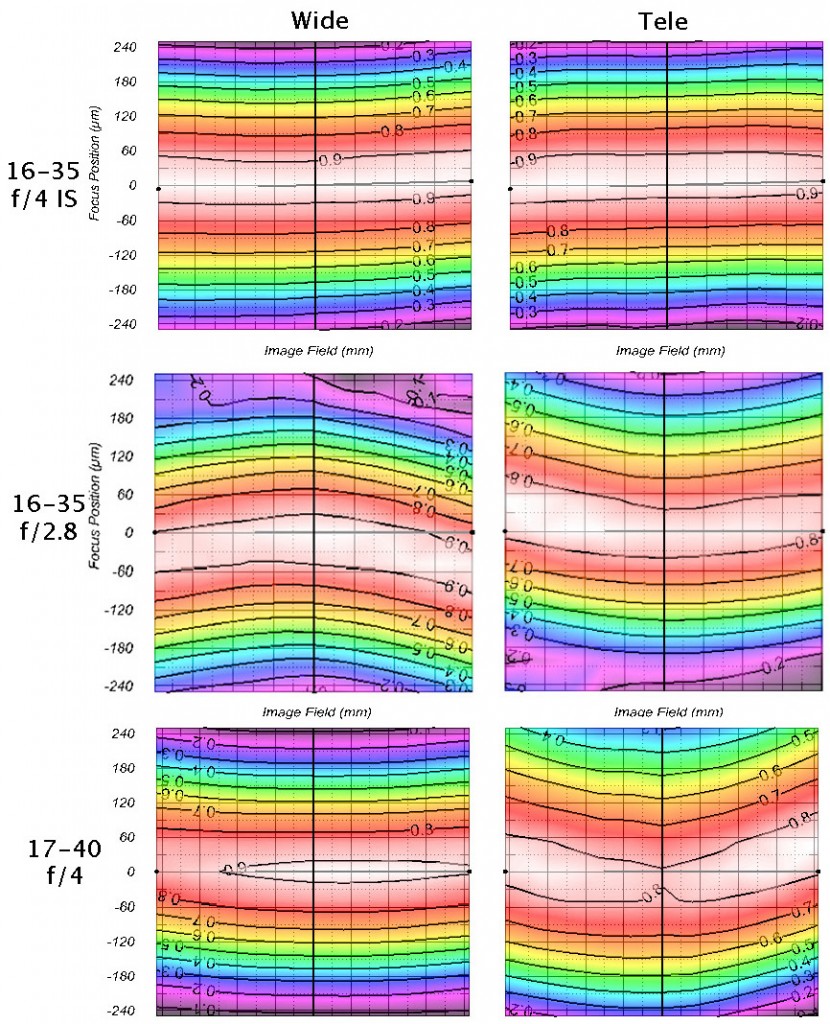
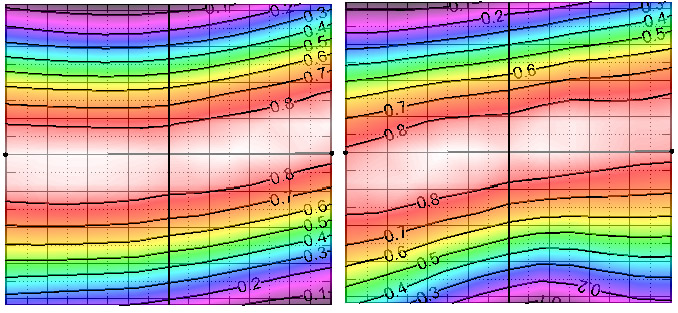
I also want to point out that these graphs aren’t average of all the lenses of each type tested; they are examples from a single copy. The software that does these calculations doesn’t allow us to average multiple lenses, but we did test all of them and they were all similar. The most common difference was just a bit of tilt of the field one way or another.
When we first started testing these lenses this surprised me a bit, but apparently this is just the nature of wide-angle zooms. The two most tilted copies we found (out of 30) are shown below. The tilt is obvious on the MTF machine, but again, notice that even with these both edges are still within the sharpest range. That’s why we don’t see this on Imatest — the flat field of an Imatest chart would still be in the sharpest focus area at both sides.
You’d be very unlikely to notice it in a photograph with lenses of this focal length and aperture because the depth of field is usually quite large. But if you took a 35mm image focusing, say, 8 feet away you might notice that on one side the sharp area went from 6 to 8 feet and on the other from 8 to 13 feet.
Distortion
All wide-angle zooms are going to have some distortion and these are no different. Distortion measurements differ with different testing methods, so I’ll provide both Imatest measurements and optical bench measurements. Remember, Imatest is measured at about 4 feet for the wide end, about 9 feet at the long end, while optical bench results are at infinity.
Wide (Imatest) Tele (Imatest) Wide (Bench) Tele (Bench)
16-35mm f/2.8 2.65% -1.7% 0.6% -0.65%
17-40mm f/4 2.6% -1.1% 0.7 -0.6%
16-35mm f/4 IS 2.95% -1.05% 0.8% -0.75%
There are some differences between the 3 lenses, but not anything significant enough to affect one’s choice of lens, I think.
Sample Variation
When using Imatest, I showed sample variation as a scattergram with each copy represented as a dot placed on a grid showing peak and average MTF50. We’ve used it for years and it works fairly well, but we’re aware it’s a blunt tool. For example, when we’re testing our own lenses there are a number that pass the ‘peak-average’ resolution test, but are clearly not OK. Usually they have one bad corner or one bad side that while clearly unacceptable, isn’t enough to drop the overall numbers to failing.
This is particularly common with wide-angle zooms, so I was eager to look at the amount of variation we saw on the optical bench.
Within-Copy Variation
First, let’s look at how much each copy varies from one area to another. Remember we test each copy at 4 different angles. For each lens we recorded the difference between the best and worst of the 4 readings at each of 20 locations from edge to edge. The graph below shows the average variance of all readings at each point (sagittal, tangential, at 10, 20, and 30 line pairs /mm).
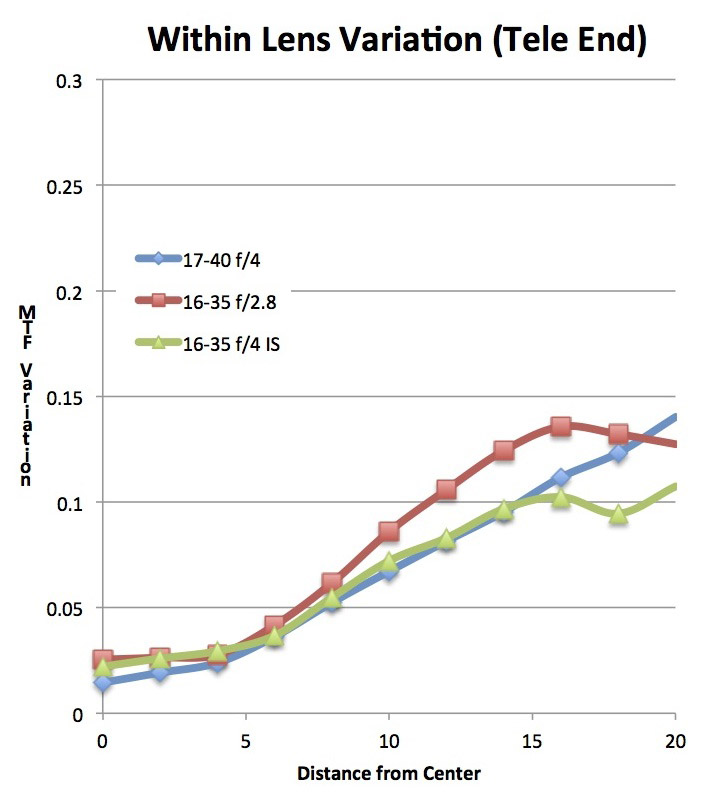
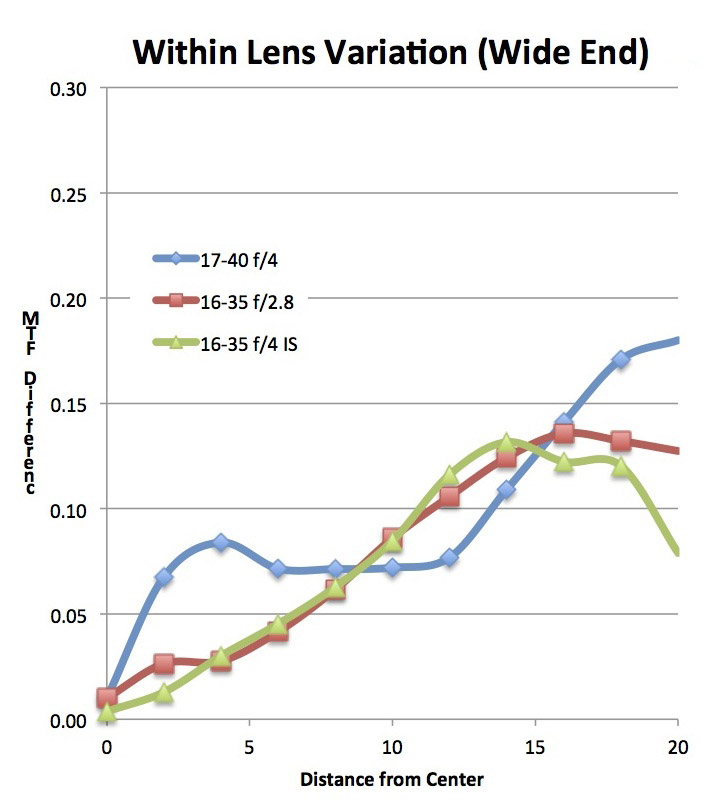
I should make one point right away. Notice that at “0”, the center, there is a slight bit of variation. In theory, this shouldn’t be, the center should always be the same. In reality, rotating the lens around the center makes a tiny difference in location of the center on the machine’s table; there are slight differences when the same measure is repeated; etc. So this ‘center variation’ really is a good demonstration of the accuracy of the tests.
All three lenses, at both the wide and telephoto end, have roughly the same amount of variation. On average, any of the thirty lenses have one corner that is 10 to 15 MTF points lower than the best corner.
For you ‘best possible copy’ chasers out there, the deviation was pretty low. None of the 30 lenses were less than 9 or more than 20 MTF points difference from best to worst corner.
You Want Some Pictures of That Corner Variation, Don’t You?
I know what you’re thinking. “Roger, take some amazing real life photographs to show us this difference of which you speak!” Well, OK! Here are some amazing real life photographs of a 5-micron pinhole. Let’s face it, no matter what I took a photograph of, you were going to tell me the composition was bad and the lighting wasn’t ideal, either. (Both of which are usually true in my photographs.) So I might as well make them useful. A 5-micron pinhole is about the right size to fill up one pixel on a 5D Mk III (about 6 microns square).
I picked a typical copy (average amount of corner variation) for each lens, put it on OLAF, and took images of the pinhole at a 40 degree angle of view, which is just about in the corner of the lens at 16mm. I should add each corner pinhole image is at best focus for that image, so this isn’t about field curvature or tilt. This is the best possible image the lens can make in that corner.
We’ll start with the 17-40 f/4,
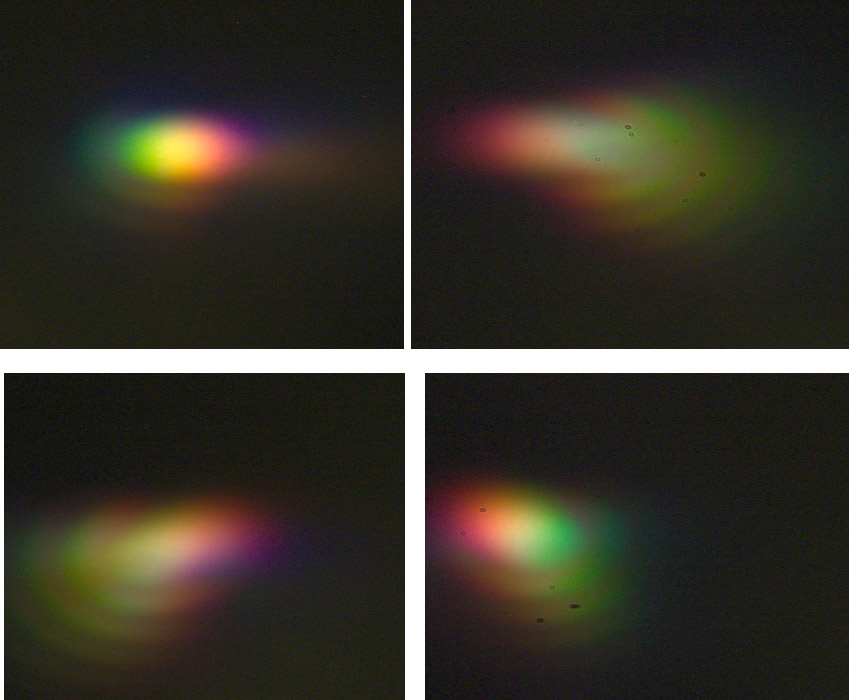
- Four corner pinhole images showing typical variation for a 17-40 f/4 lens at 17mm.
then the 16-35 f/2.8,
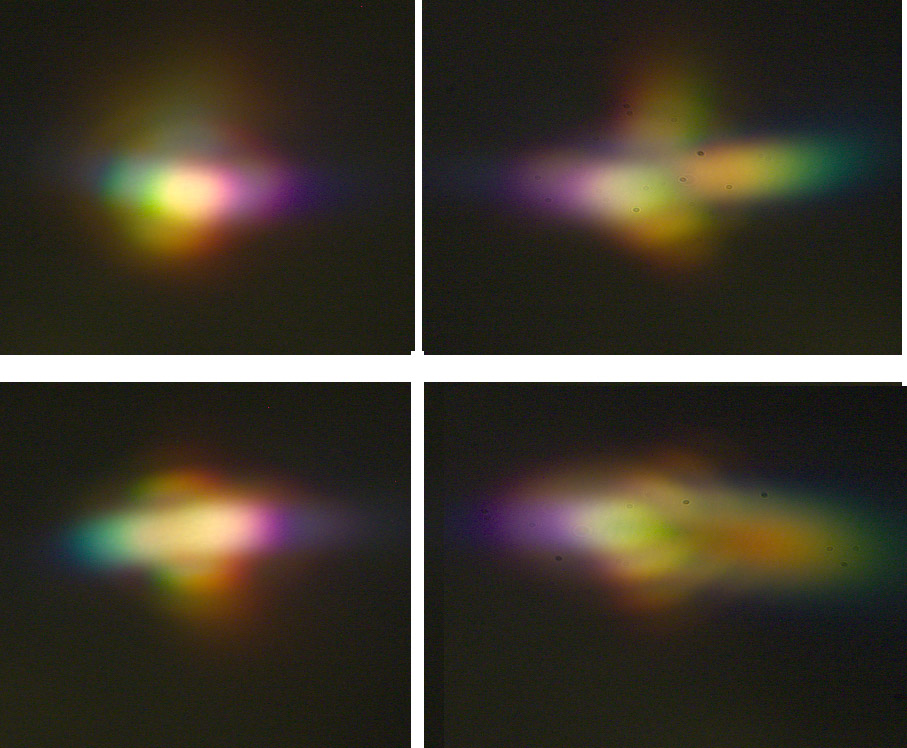
- Four corner pinhole images for a typical Canon 16-35 f/2.8 II at 16mm.
and finally the 16-35 f/4 IS.
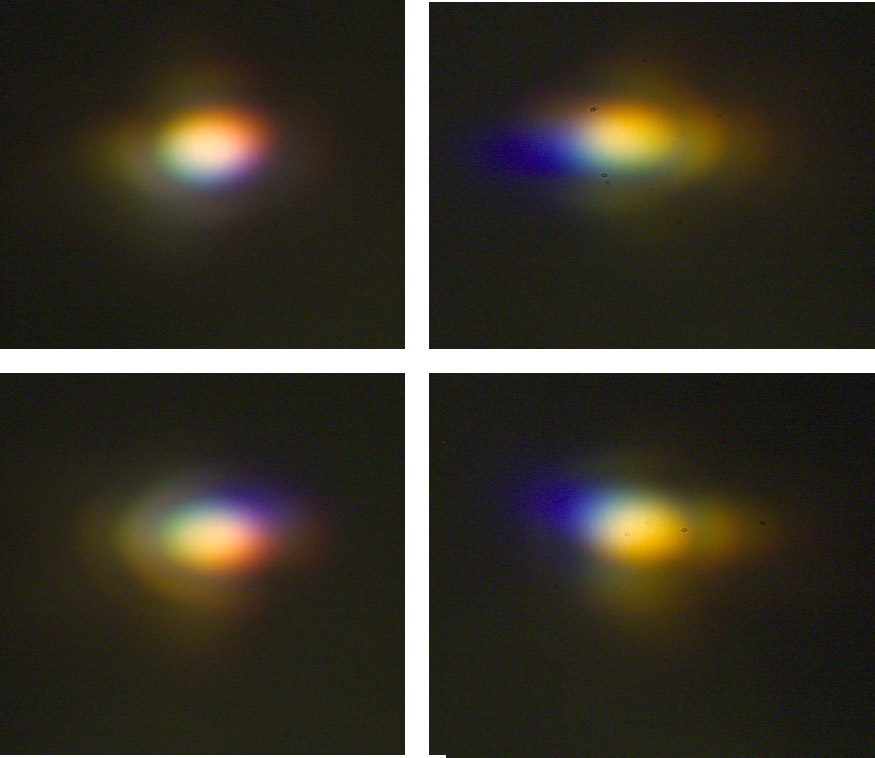
- Four corner pinhole images showing typical variation for a 16-35 f/4 IS lens at 16mm.
Do these pictures mean anything? Well, it does show that what the optical bench sees correlates with reality. For each set of four images above I think you can identify one corner or side that’s a bit better than the other side, just like the optical bench says you could.
But could you actually see a difference in a photograph? Perhaps, but we couldn’t in any of these three lenses, even photographing high-resolution test charts under testing conditions. I’ll add, for what it’s worth, that we use this pinhole view to do most of our optical adjustments and from long experience I wouldn’t try to improve any of these. I’d be far more likely to make them worse than better.
Why then, are some people testing their new 16-35 f/4 IS lenses saying they can see a softer corner or side? Well, a few of them probably have an out-of-spec lens. That happens occasionally with every zoom I’ve ever seen. But I’ll also suggest that some of it has to do with the fact that the 16-35 f/4 IS lens is sharper in the corners than the older lenses.
Scroll back up to the side-by-side MTF charts of the 16-35 f/4 vs. 17-40 and 16-35 f/2.8 II. Look at the edge area (18-20mm from center) and consider the MTF50 line (MTF 0.50 on the graph). For the 17-40 and 16-35 f/2.8 II, only the 10 and 20 lp/mm sagittal lines are at MTF50 or above at 18mm. With the 16-35 f/4 even 40 lp/mm is above the MTF50 line.
When photographing sharpness charts that test resolution (and therefore things like MTF50), you can see a difference in corners much more clearly on the 16-35 f/4 IS. To put it simply, in testing on-camera it’s easy to tell the difference between sharp and not sharp. The difference between not sharp and pretty soft is hard to see. So it’s less likely we would notice this variation in the 17-40 or 16-35 f/2.8 II lens, since they’re already softer in the corners.
Variation Between Copies
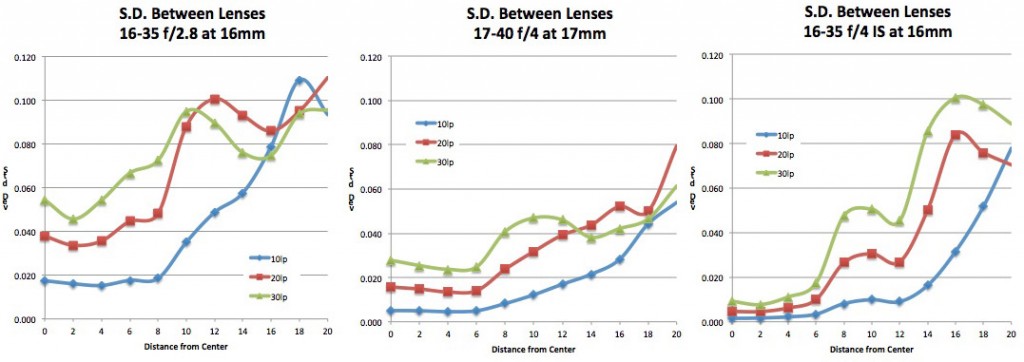
Next we’ll look at variation between different copies of the same lens. For this we took the standard deviation of all copies of each lens at every measured point.
First the standard deviation between copies at the wide end.
Now the SD between copies at the telephoto end.
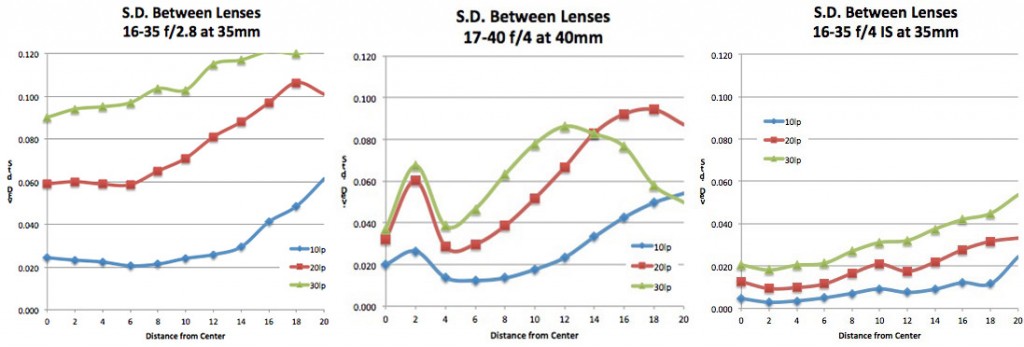
I was surprised at how little variation the 16-35 f/4 IS had at the long end. I won’t say I’m surprised by how much variation there was in the 16-35 f/2.8 II. Regular readers of this blog know we have more trouble with the optics on that lens than any other Canon lens. Nevertheless, I wanted to check and recheck these numbers and look at them several ways. Then we even did some optical retesting.
But everything seems to agree – there’s more sample variation in the 16-35 f/2.8 II lenses and less in the 16-35 f/4 IS at 35mm. At the wide end the difference isn’t as striking.
Remember, this isn’t sample variation caused by one or two badly decentered copies; we’d already screened those out using methods we’re pretty comfortable with. This is ‘how much variation do we see between the acceptable copies’. For completeness, though, let’s remember the 16-35 f/2.8 and 17-40 lenses were off the Lensrentals shelves while the 16-35 f/4 IS had been rented once at most. Even if we assume the older two lenses would be better out of the box (I don’t, but I can see where others might) it still is a very nice performance by the 16-35 f/4 IS.
One Last Comparison
I’m completely aware that a lot of people love their 16-35 f/2.8 II and 17-40 f/4 lenses. I’ve never been a huge fan of them, and usually shoot a wide prime lens (Canon 17 TS-E or 14mm f/2.8) on Canon bodies. If I know I’m going to shoot a lot of wide-angle images, I’ll often check out Nikon D800 and 14-24 f/2.8. So for purely selfish reasons I wanted to see how well the new 16-35 f/4 IS compares with these lenses.
In the following graphs the newly introduced lenses are NOT averages of a dozen copies, they’re test results from single copies. I’ll do complete comparisons in the future with multiple copies of them. This was just to give myself a quick estimate as to whether further testing was worthwhile, and I thought I’d share it with you.
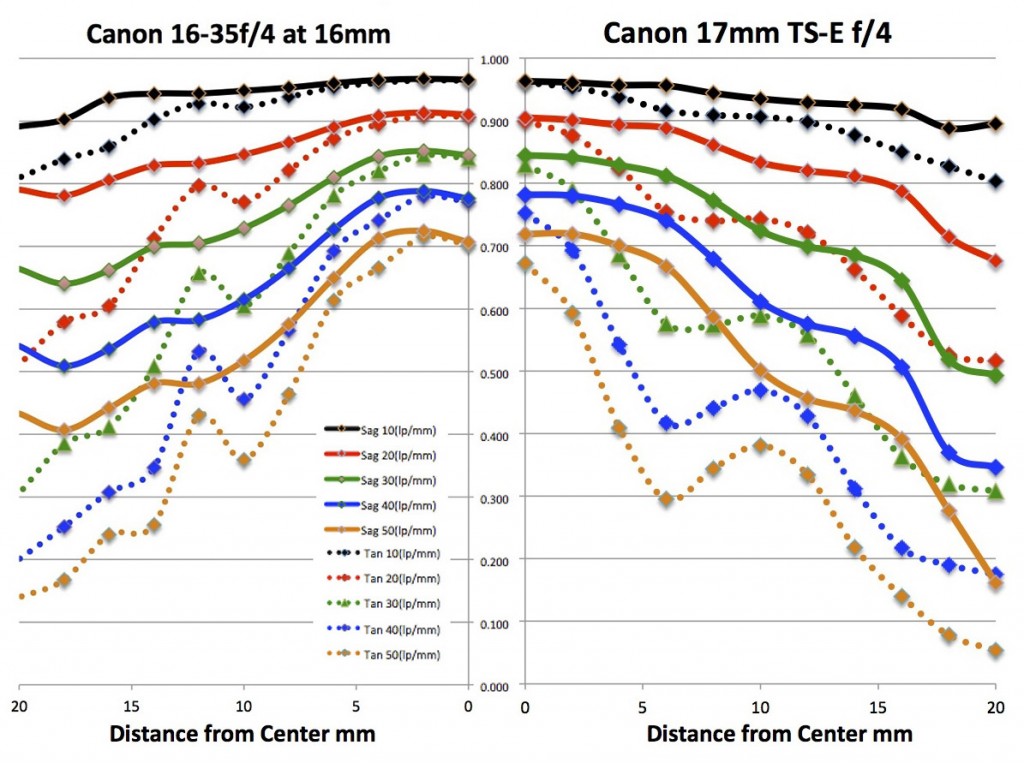
Canon 16-35 f/4 IS versus Canon 17mm f/4 TS-E
This is done with both lenses at widest zoom. I don’t know if the results shock you, but they did shock me. The MTF charts clearly show the TS-E is better at . . . tilting and shifting. That’s huge for me, because I often used it as a straight lens, never intending to use the tilt-shift features, simply because of its resolution. Of course, the TS-E has less distortion than the zoom does, and that can also be important even if you don’t plan to use the tilt-shift features.
Canon 16-35 f/4 IS versus Nikon 14-24 f/2.8
I hesitated to put this up, because I know it will start fanboy flame wars. So first and foremost let me state clearly: This compares the Canon at f/4 to the Nikon at f/2.8. (Nikon’s electrically set mechanical aperture is a real pain to set to f/4 for testing off of the camera body. It can be done, but it’s time consuming. It will have to wait until I have time to do a full comparison.)
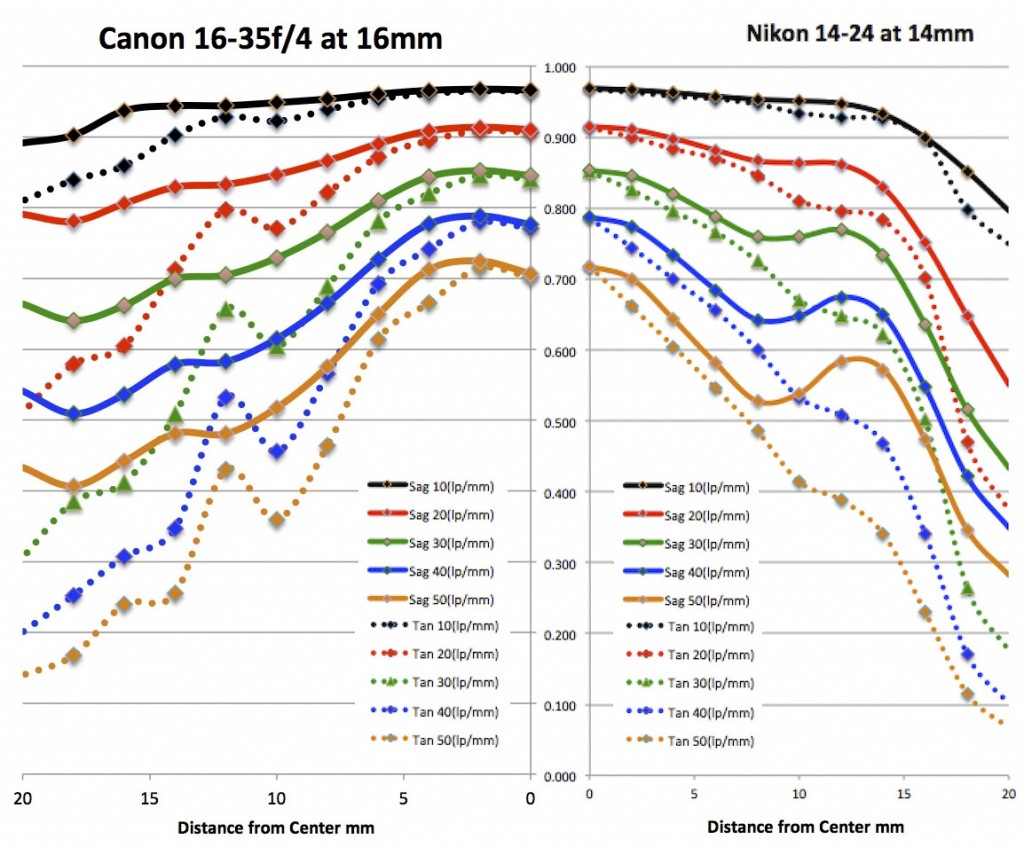
The Nikon will definitely improve at f/4; probably enough to be as good as, or even slightly better than the 16-35 f/4 IS. But they’ll be hair-splitting close, I expect. So for the people who shoot the Nikon 14-24 f/2.8 on a Canon camera via an adapter, the 16-35 f/4 IS will definitely give them a new option.
Conclusion
I set a high bar for new Canon lenses. I expect them to be excellent and generally their recent releases have been. Since this was a wide-angle zoom, though, my expectations were lowered a bit. Canon has always struggled with wide-angle zooms. The 17-40 is a good, not great lens. The 16-35 f/2.8 II is better than the Mk I replaced, but I’d consider it, at best, adequate considering its price.
The 16-35 f/4 IS changes that. It’s a superb optic — as good as anything else available. Of course, a lot of people want an f/2.8 zoom. But for many, like me, f/4 with IS is just fine for wide-angle shooting.
I have to add that I think the price represents an excellent value, which is not something I’ve said about many Canon lenses lately. The 24-70 f/2.8 Mk II and 70-200 f/2.8 IS II are world-class optics, but I’ve never heard them called bargains. The 16-35 f/4 IS isn’t cheap, but I think it’s an excellent value. If it were the same price as the 16-35 f/2.8 II, I’d still buy one.
Roger Cicala and Aaron Closz
Lensrentals.com
July, 2014
Appendix – Data collection
For each lens MTF is measured 4 times, once each at 0, 45, 90, and 135 degrees rotation. At each rotation MTF is measured at 20 points, equivalent to every 2mm across the image surface. At each of those points, 10 measurements are recorded (MTF in sagittal and tangential plane for 10, 20, 30, 40, and 50 line pairs/mm. So a single rotation measurement looks like this:

The average (mean) and standard deviation of the 4 MTF readings at each position and for each line pair frequency is then calculated as a summary table for that copy. The astigmatism (difference between sagittal and tangential readings for each position and frequency) is also calculated for each frequency and position.
A zero variance check of all the original tables (there would be 80 in a 10-copy test) is done to be a reading was not accidently transposed twice. Additionally, readings are compared to verify some aspects of the testing. For example if all lenses read slightly lower on one side or at one rotation we might have an issue with proper leveling of the rotation table or calibration of the collimator.
Next all of the copies for each lens are summed and compared. The final MTF graphs are the average of all readings at each position, with the positive and negative points also averaged. (In other words, the MTF, standard deviation, and astigmatism readings at position ’20’ on the graph is the average of +20mm and -20mm from the tables.)
Although we don’t show it in these articles, we then check each copy’s averages against the mean of all copies to identify any outliers. In this particular series one lens was removed from testing early in the process (during the Imatest phase) because it was identified in this manner and further testing showed it to be decentered.
Author: Roger Cicala
I’m Roger and I am the founder of Lensrentals.com. Hailed as one of the optic nerds here, I enjoy shooting collimated light through 30X microscope objectives in my spare time. When I do take real pictures I like using something different: a Medium format, or Pentax K1, or a Sony RX1R.
-
Nicholas Gonzalez
-
AaronClosz
-
Nicholas Gonzalez
-
Mk.82
